
The Numbers Behind Divine Providence
Across all 209 Archdiocese of Detroit parishes, one small Lithuanian parish inverts every assumption — bottom on scale, top 5% on resource depth, already back in the black.

As part of its current restructuring, the Archdiocese of Detroit produced a workbook for each of its parishes. Read Divine Providence’s workbook alone, and the story is grim: a small, aging Lithuanian parish running a deficit. But the Archdiocese produced these workbooks for all 209 of its parishes, across 15 Planning Areas. Read together, they tell a very different story about the same parish.
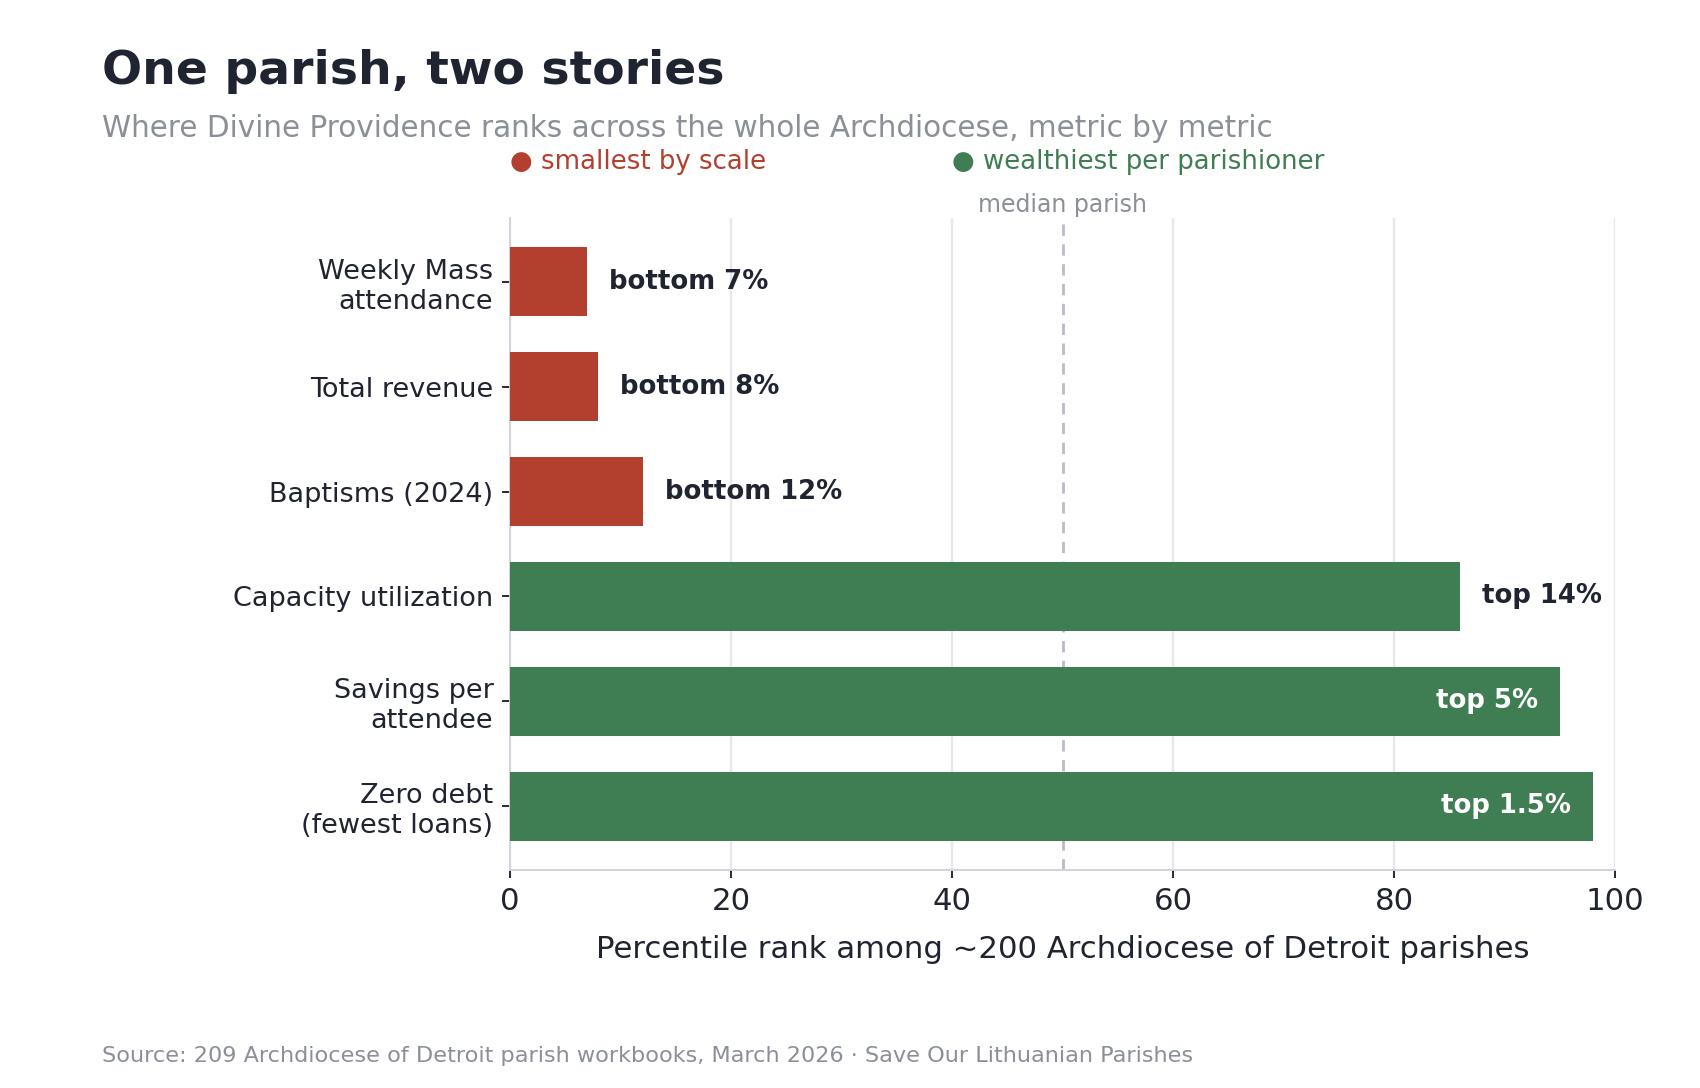
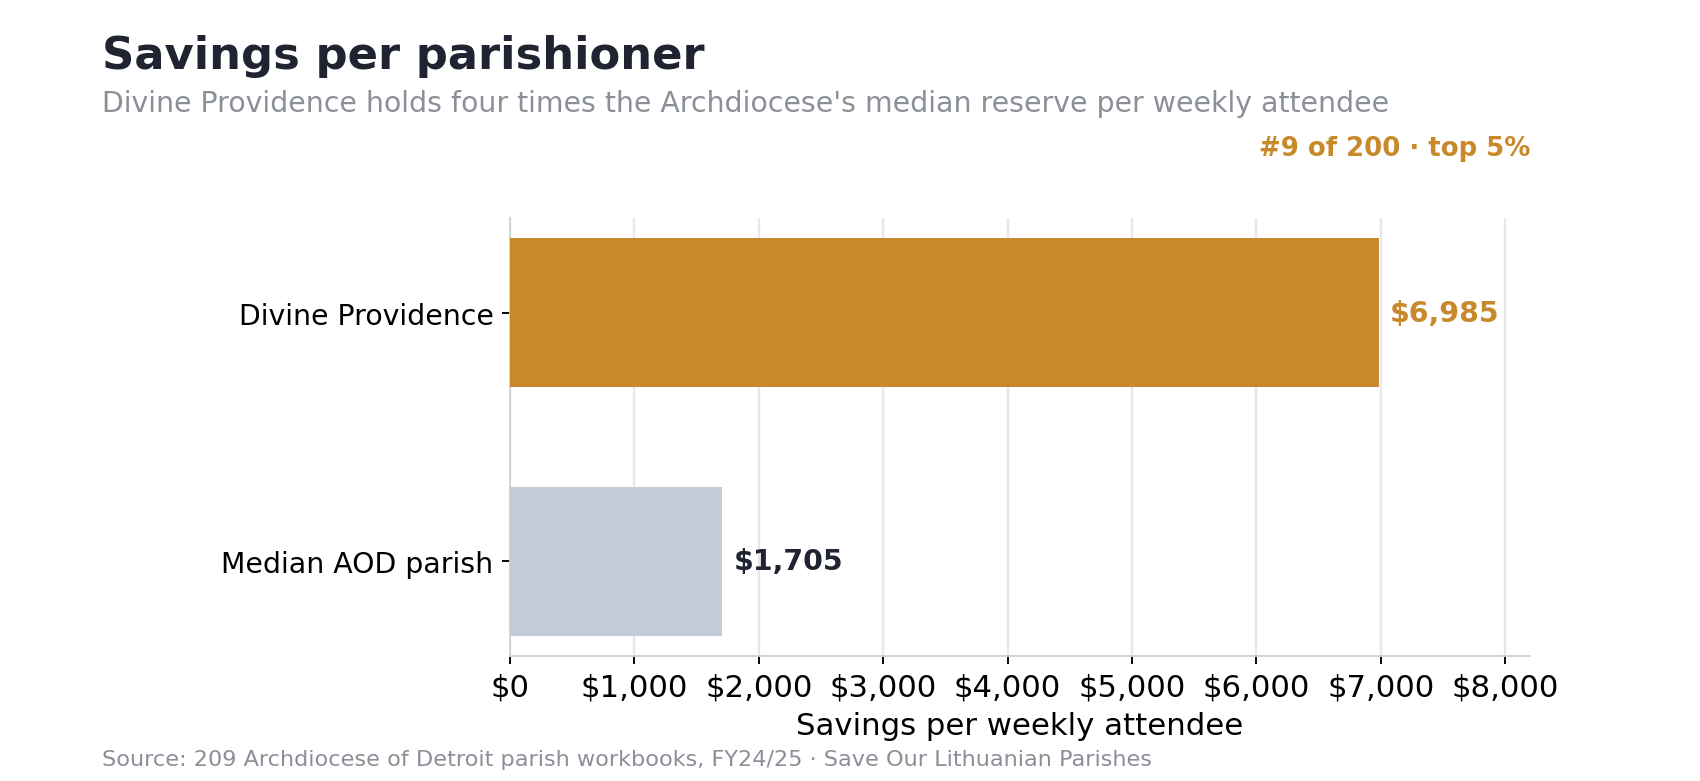
One truth emerges when you rank Divine Providence against the whole Archdiocese: it is among the smallest parishes by scale, and among the wealthiest by resource per parishioner. The Archdiocese is treating Divine Providence like a poor parish that should be merged. Its own data shows a small parish that is rich on a per-parishioner basis — a category its metrics don’t have a slot for. The chart below is the whole argument in one picture.
Small by every measure of scale
By the numbers the Archdiocese leads with, Divine Providence is genuinely small:
144 weekly Mass attendees — #191 of 204 ranked parishes archdiocese-wide (bottom 7%).
3 baptisms in 2024 — #184 of 209.
$260K total revenue — the smallest parish operation in its Planning Area.
On the metrics the Archdiocese prioritizes — attendance, sacramental throughput, priest-to-attendee ratio — this is a hard parish to defend. That is real, and worth stating plainly.
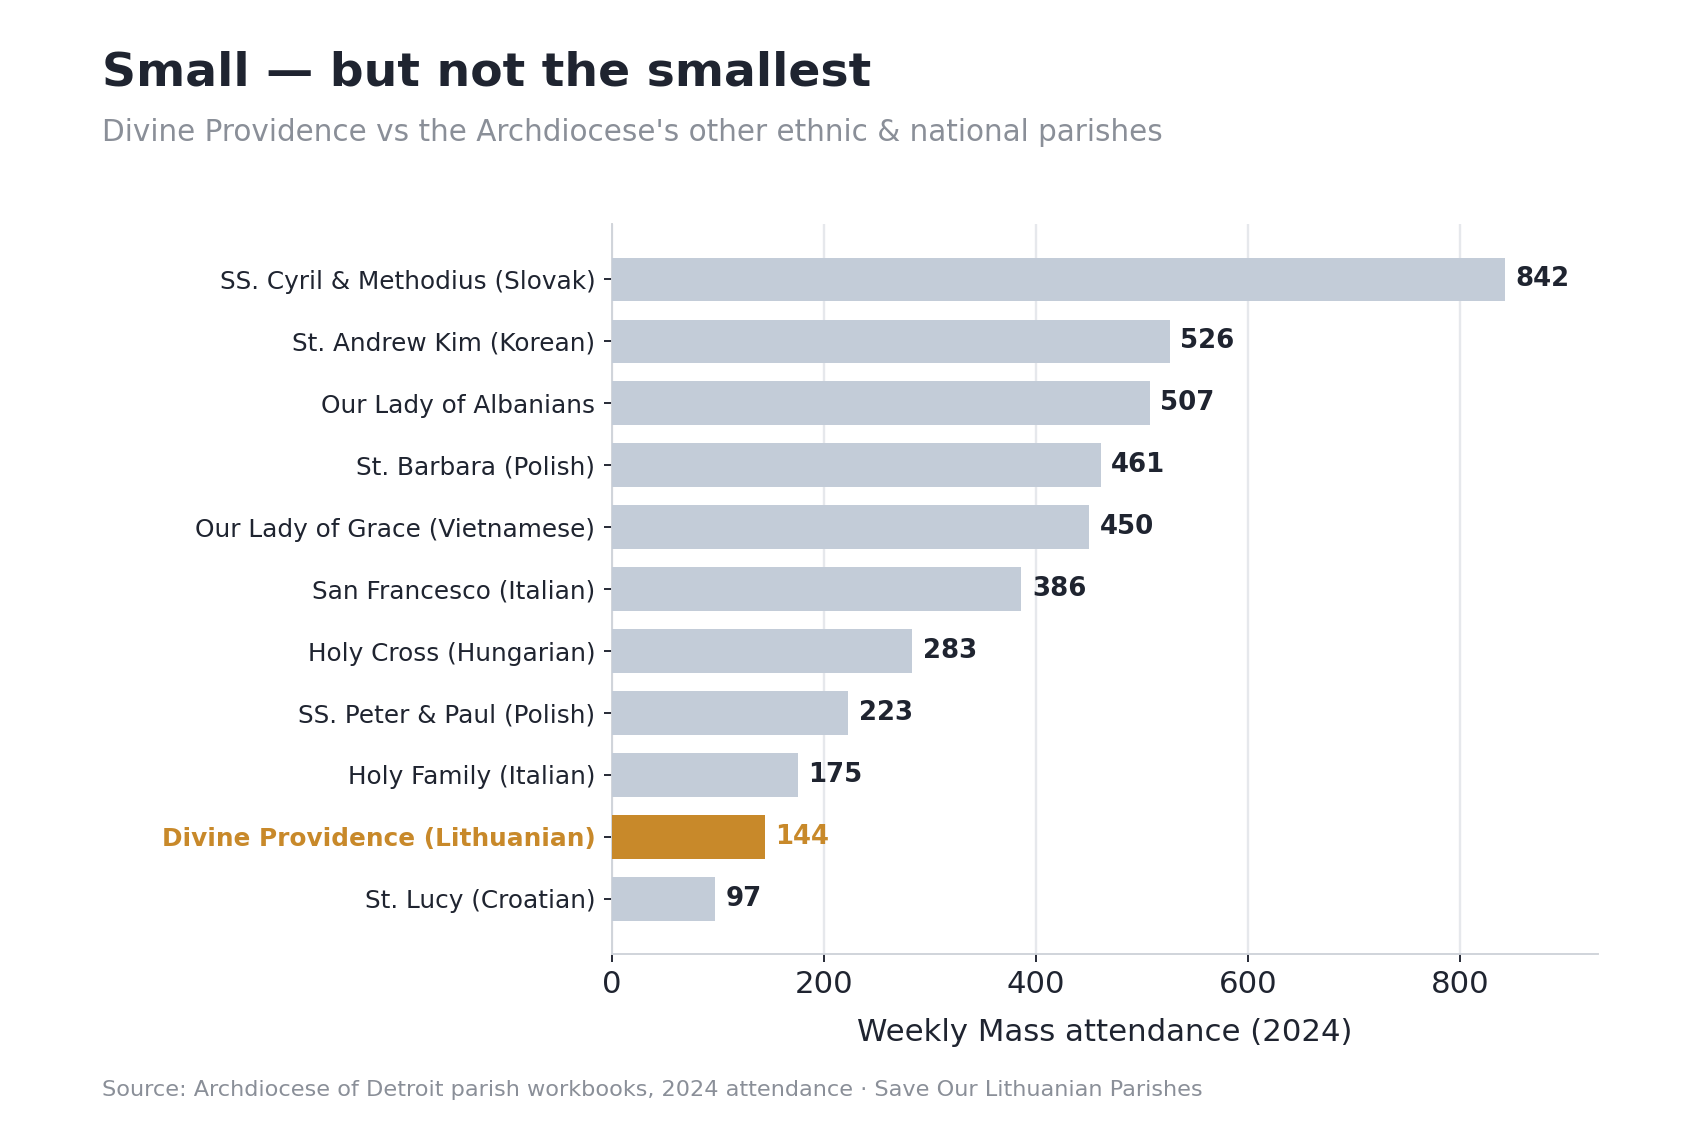
Small — but not the smallest
Step outside Divine Providence’s own Planning Area and set it beside the Archdiocese’s other ethnic and national parishes — the Slovak, Korean, Albanian, Polish, Vietnamese, Italian, Hungarian, and Croatian communities that, like ours, are defined by heritage and rite rather than by a neighborhood boundary. Among that peer group, Divine Providence is small, but it is not the smallest: St. Lucy, the Croatian parish, is smaller still. And its deficit is far from the worst — three of these ethnic parishes are running larger operating losses. A small ethnic parish carrying a modest, recoverable shortfall is not an outlier in this company. It is a representative member of it.
Rich by every measure of resource depth
Now rank the same parish by what it holds per parishioner — and it climbs to the very top of the Archdiocese:
Savings per weekly attendee: #9 of 200 archdiocese-wide — top 5%.
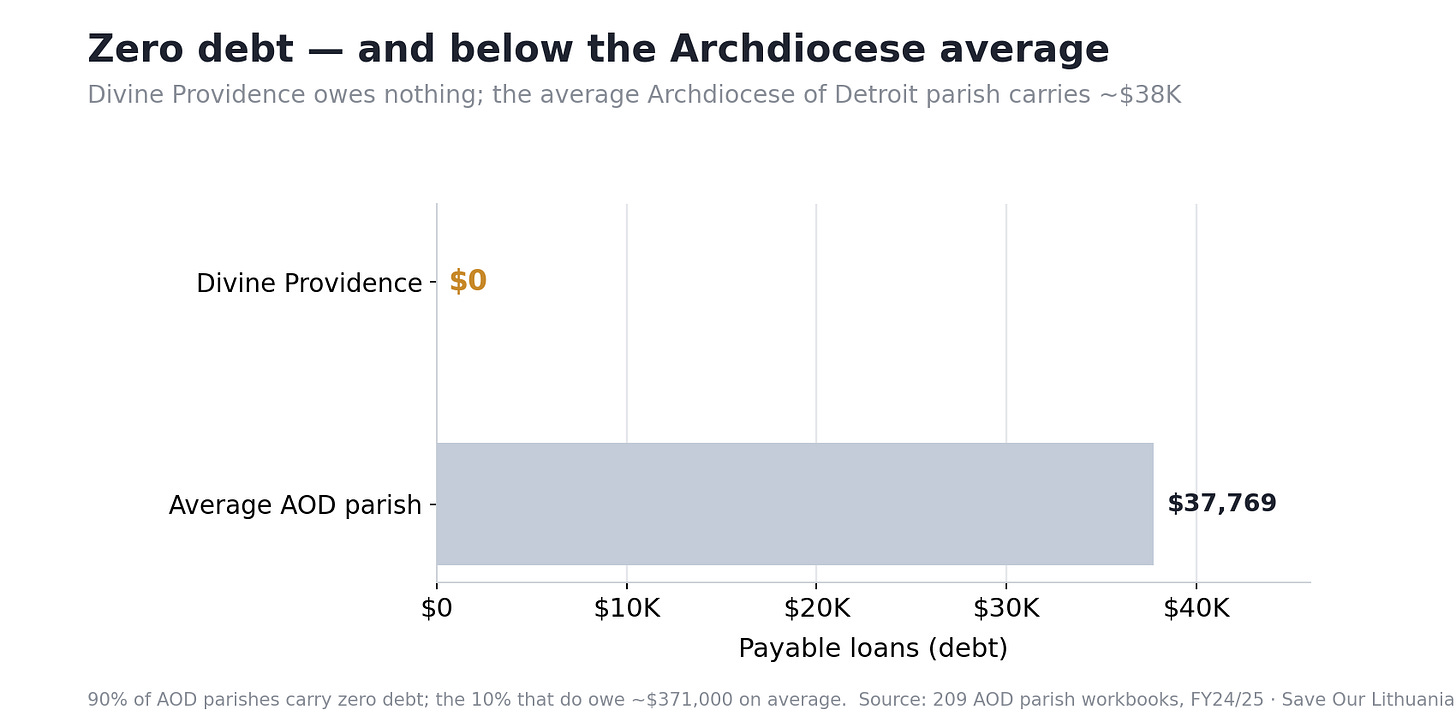
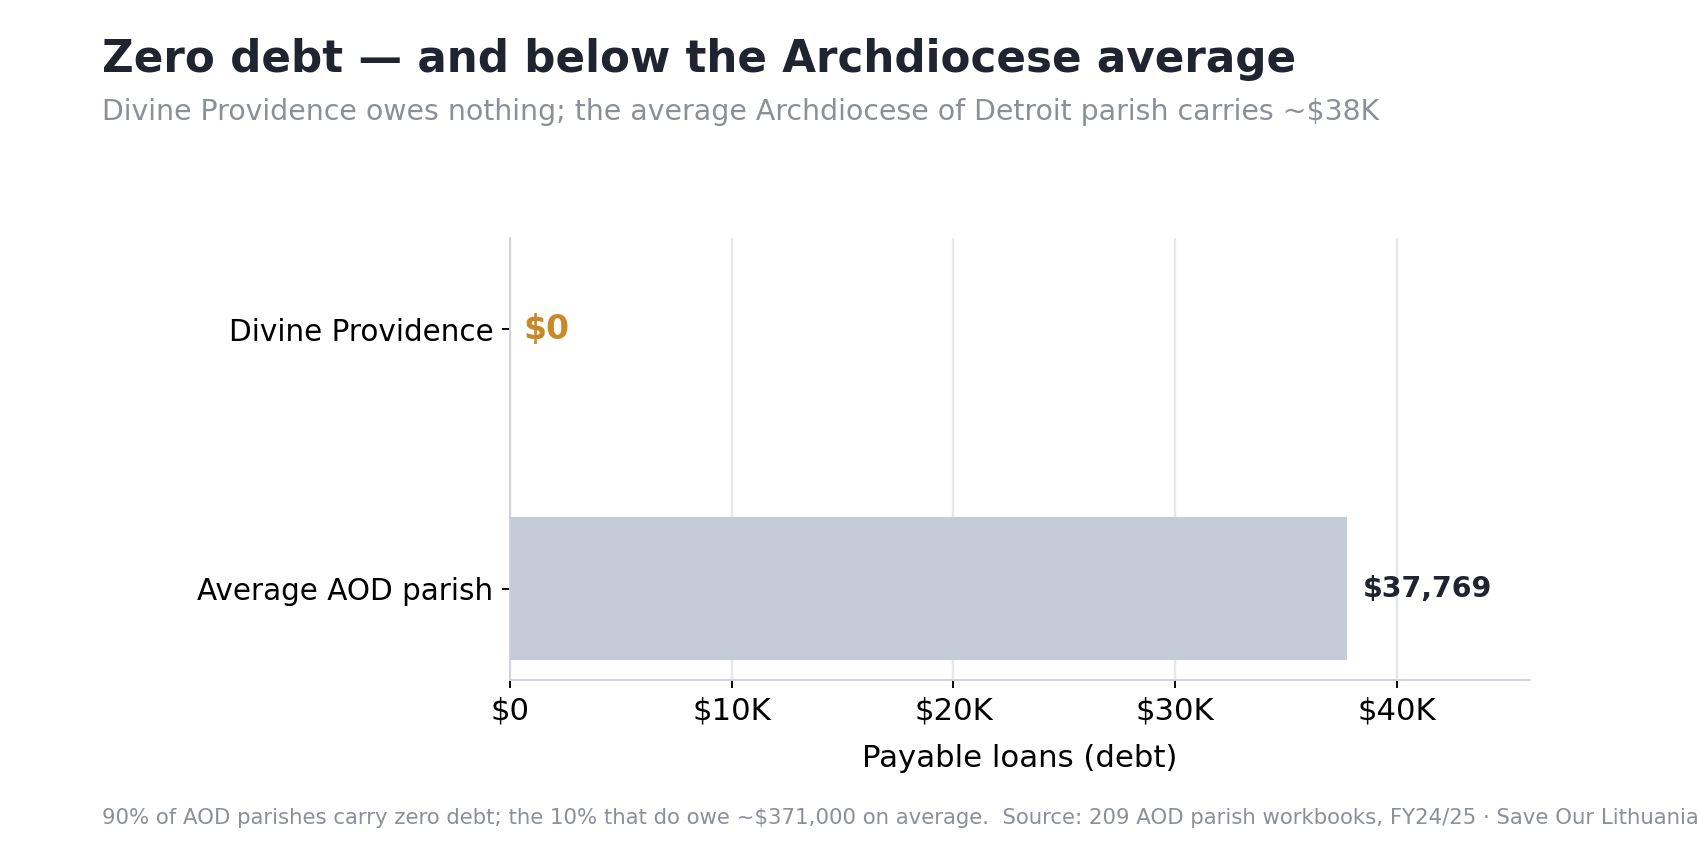
Payable loans: #3 of 207 — effectively zero debt.
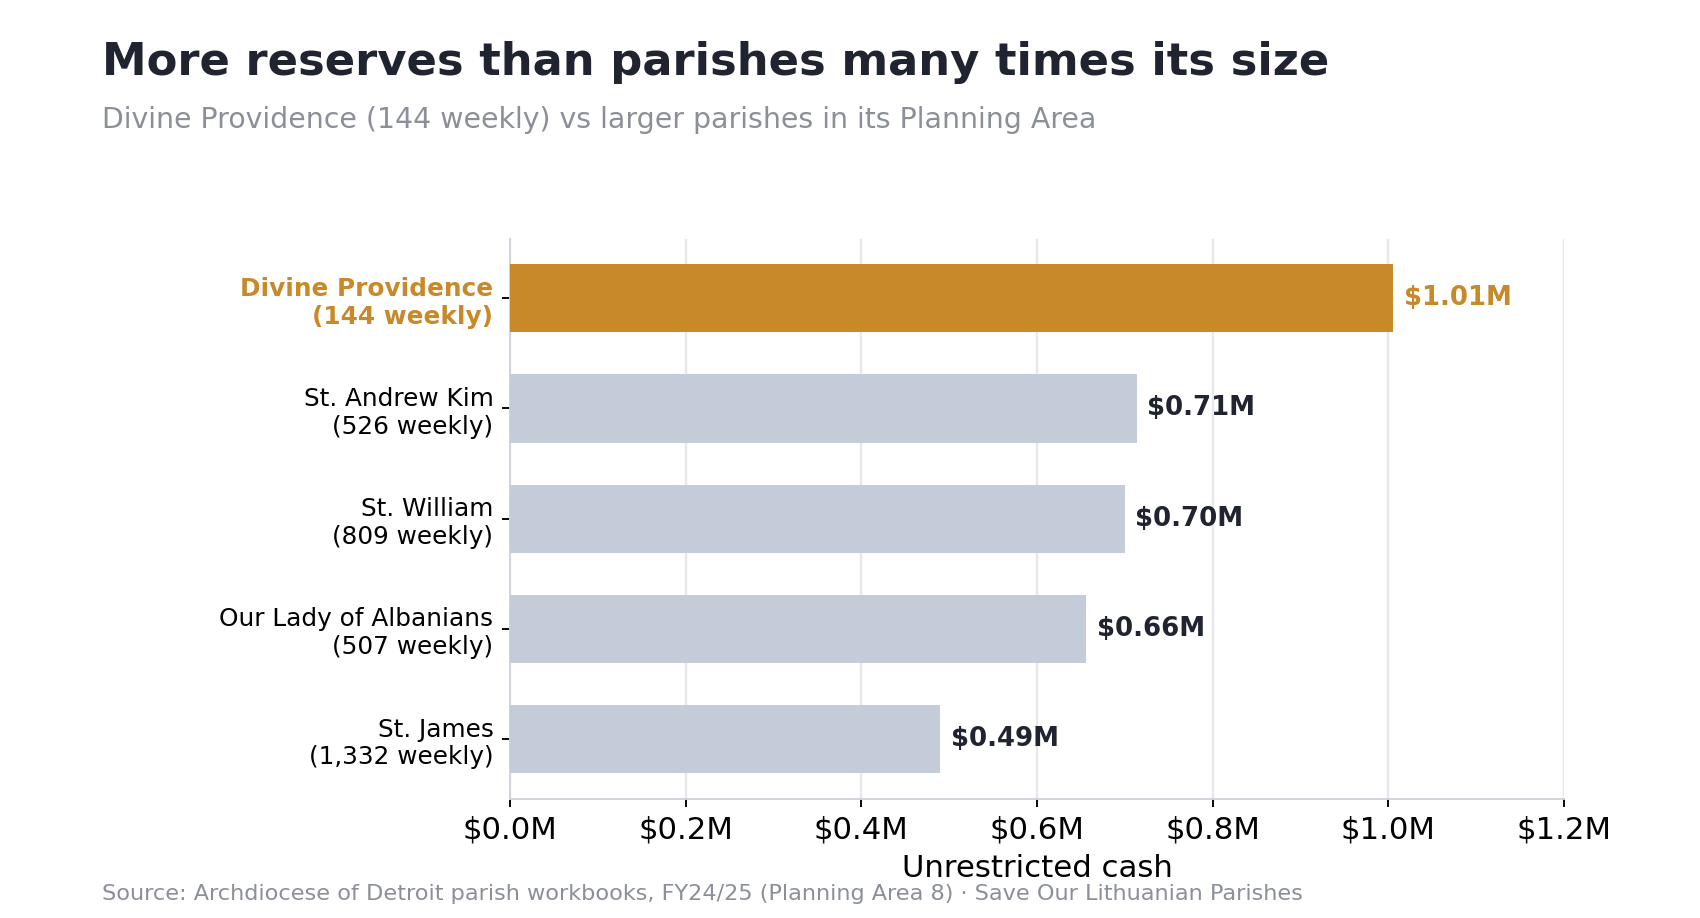
Over $1 million in unrestricted cash, net equity above $1 million, and roughly 19 years of runway at the current burn rate.
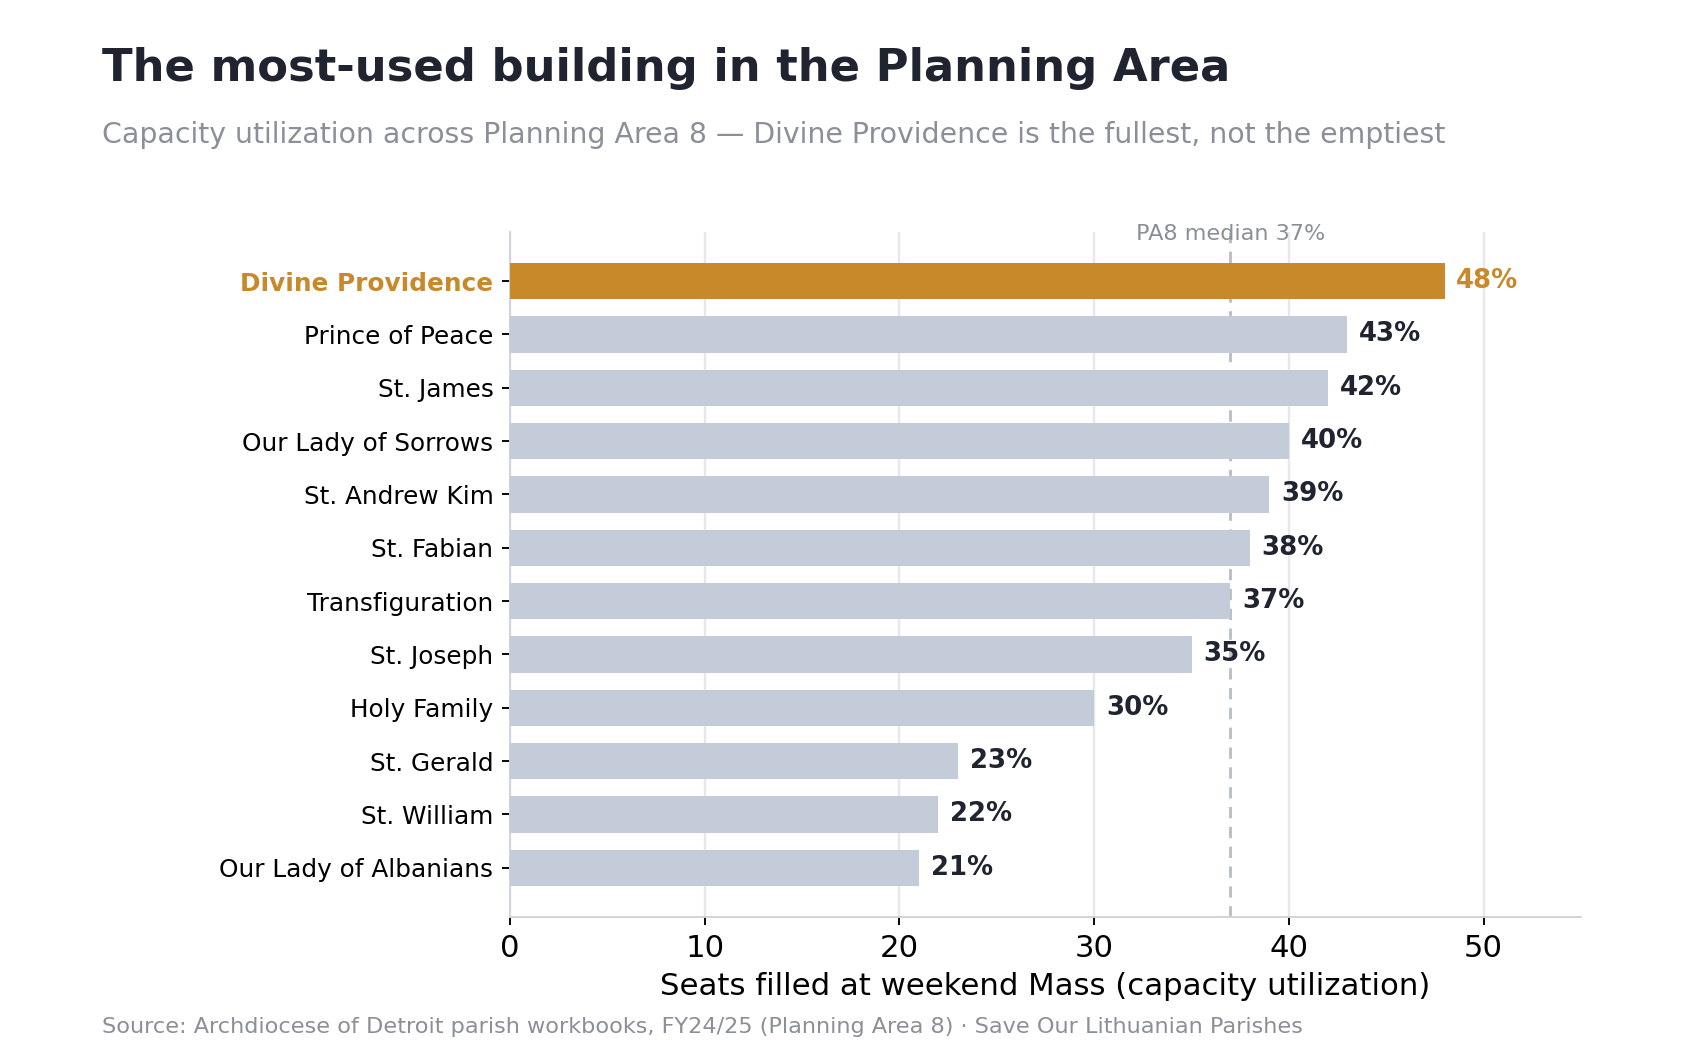
The highest capacity utilization in its Planning Area (48% vs. a 37% median) — the “underused building” story is false on the data.
The deficit already reversed
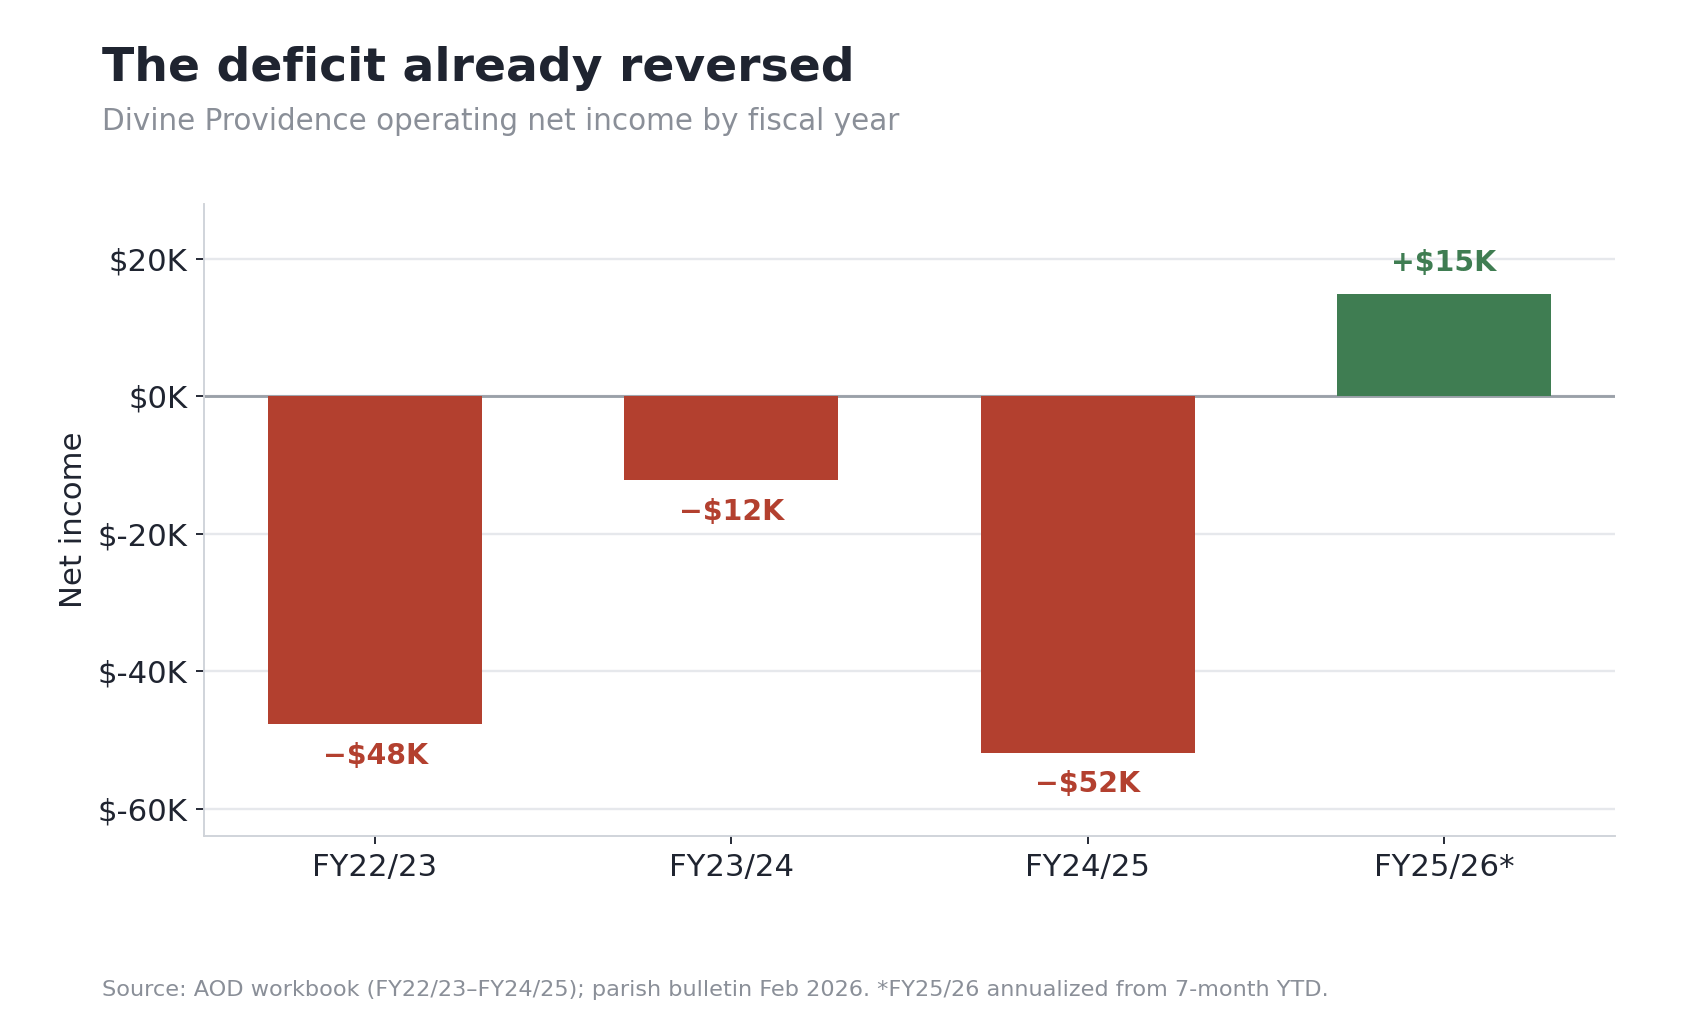
There is one more number the workbook misses, because it is looking at last year. The Archdiocese is evaluating Divine Providence on a fiscal year in which it ran a roughly $52,000 deficit. But the parish’s own bulletin tells a different story: through the first seven months of the current fiscal year, Divine Providence is running a net surplus of about $8,700 — on track for roughly +$15,000 for the year, before any new initiatives. Three years of red gave way to black without a single change the Archdiocese asked for. The turnaround has already happened; the Archdiocese is still watching last year’s movie.
The workbook itself understates the parish
The published workbook doesn’t just look at the wrong year — it also gets the current one wrong. Its figures materially understate Divine Providence’s sacramental life:
Confirmations in 2024: the workbook says 6. The parish register shows 18 — a threefold undercount.
Confirmations in 2025: 7, absent from the workbook entirely.
Baptisms so far in 2026: 5 — already more than all of 2024 combined.
A 2026 wedding, where the workbook records a single marriage for all of 2024.
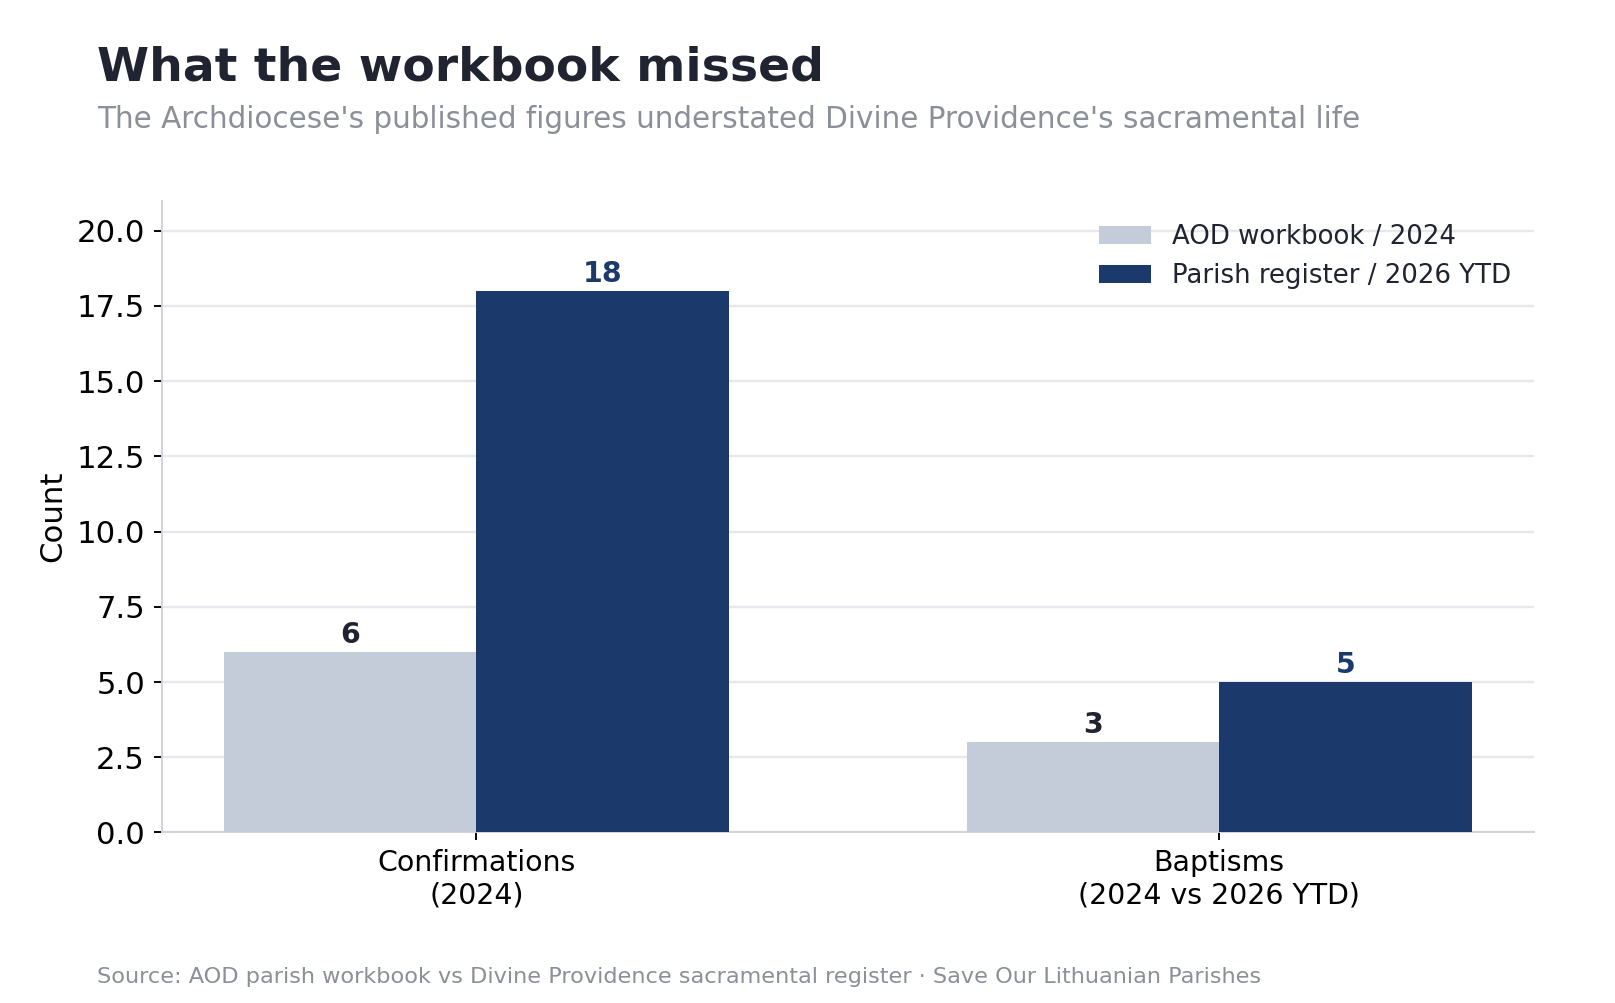
The confirmations correction alone moves Divine Providence from near the bottom of the archdiocese’s sacramental ranking to roughly the middle. The trend the Archdiocese is extrapolating from — a parish quietly winding down — is no longer the trend on the ground.
A category error
Underneath all of this is a single mismatch. Divine Providence is not a territorial parish — it does not serve a neighborhood. It is a personal parish, defined by language and rite: roughly 65% of its parishioners come from outside the local boundary, many driving nearly an hour, from across Michigan and Canada. Applying territorial-parish metrics — neighborhood demographics, boundary registration, regional capture rate — to a parish built for a dispersed diaspora measures the wrong thing. The parish is functioning exactly as designed.
The one hard number
None of this means the Archdiocese is acting in bad faith. It is managing a real and painful shortage of priests across 209 parishes, and by that single measure — a full-time priest assigned to 144 worshippers — Divine Providence is genuinely hard to justify. That is the one metric the parish cannot win by argument alone; it can only be answered by a different staffing model, such as a shared priest. But priest allocation is a question about how the parish is served, not about whether it is viable. On viability, the data is not close.
Which yardstick?
None of this relitigates the attendance number. Divine Providence is small, and the priest shortage is real. But small is not the same as failing, and last year’s deficit is not this year’s. The question the data raises is not whether Divine Providence is worth keeping. It is which yardstick the Archdiocese should use to measure a small, solvent, growing personal parish its own metrics were never designed to see.
This benchmark reads Divine Providence against 29 Archdiocese of Detroit parish workbooks published in March 2026, covering all 209 parishes across 15 Planning Areas, with the financial trajectory updated from the parish’s own February 2026 bulletin.
A note on method: every figure here comes from the Archdiocese of Detroit’s own FY24/25 parish workbook for all 209 parishes. “Per weekly attendee” and “years of runway” are computed from reported Mass attendance and net income, and each ranking is among the parishes that report that particular field. Nothing here is estimated or adjusted — it is the Archdiocese’s data, read a different way.